Graph all of the inequalities on the same set of axes.
Find the area where the solutions overlap.
EX:
y ≥ 3x – 1
x < 4
First, graph each inequality on the same set of axes:
Here’s y ≥ 3x -1 without shading
(Remember the line is solid because it’s greater than or equal to)
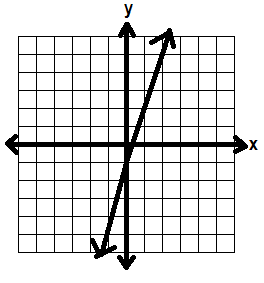
Then we’ll graph x < 4 on the same set of axes, again without shading.
(Remember this line is dotted because x is less than but not equal to 4)
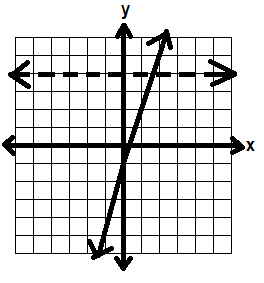
Now we need to look at the shading.
For y ≥ 3x – 1, let’s use test point (-1, 1)
Plug it into the inequality:
1≥ 3(-1) – 1
1≥ -3 – 1
1 ≥ -4
That’s true, so we shade on that side—the left side—of the line.
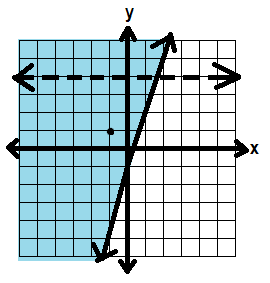
Let’s use that same test point for x < 4
-1 < 4
That’s also true, so we shade on the bottom side of that line.
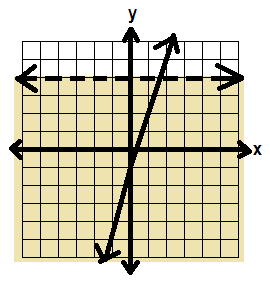
In this system, we want to look for the places that BOTH inequalities are true—where the shading overlaps.
That’s in the green area below:
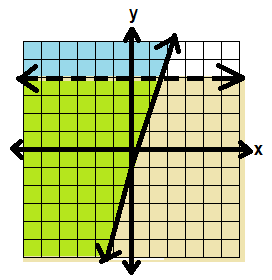
So our solution should look like this:
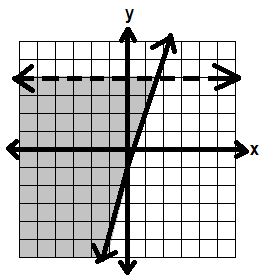
Note: You may have systems of inequalities with more than two inequalities. Then you want to find the area where all of them overlap.
Here's a video of solving systems of linear inequalities:
ReplyDeletehttp://www.youtube.com/watch?v=Xuo45InYBhY&playnext=1&list=PLC3AAFE79AFF5AD52