y = 2x -3
Here we have a slope of 2 and a y-intercept of -3. Let’s graph that line.

Now, let’s look at the inequality
y > 2x -3
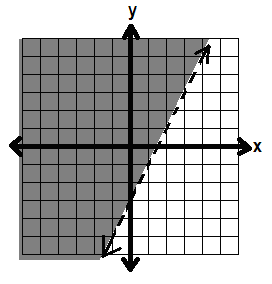
Now y isn’t equal to 2x – 3, it’s greater than 2x – 3. To show that we don’t want to include the line y = 2x – 3, we turn our solid line into a dotted line.

Then, we shade in the part (on one side of the line) where y is greater than the line 2x – 3.
We can check if we should shade above or below by using test points. Pick a point on one side of the line, and a point on the other side.

Above, I picked (-1, 1) and (3, -1)
We test the points by plugging them into the inequality, y > 2x – 3.
(-1, 1): 1 > 2(-1) -3
1 > -2 -3
1 > -5 This is true, so we say that, yes,
at this point y is greater than 2x – 3.
(3, -1): -1 > 2(3) -3
-1 > 6 -3
-1 > 3 This is NOT true, so we say that,
no, at this point y is NOT greater than 2x -3.
So we shade in the side where (-1, 1) is:

And the inequality is graphed.
STANDARD FORM
3x – 2y ≥ 6
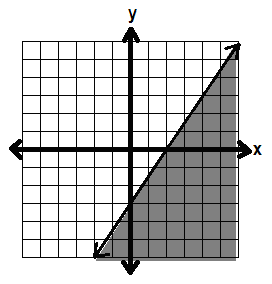
First, we graph the line 3x – 2y = 6 by finding the x- and y-intercepts.
x-int: 2, y-int: -3

In this case, because we have greater than OR equal to, we include the line. So the line stays solid.
Now we need to know which side to shade. We pick a point on one side of the line.
Let’s pick (0, 0). Plug it into the inequality, 3x – 2y ≥ 6
3(0) – 2(0) ≥ 6
0 – 0 ≥ 6
0 ≥ 6 This is false, so we don’t want to shade in
the side with (0, 0).
So we shade in the other side:

No comments:
Post a Comment