Saturday, May 14, 2011
White Packet (3rd Period)
This one's kind of tricky to follow along with the sections. Sorry about that.
Part 1: Non Calculator
Arthmetic/Basic Computation
1:b
2:d
3-7 not multiple choice
___
1:c
2:a
___
1:a
2:c
___
1:a
2:b
3:c
4:a
5:c
___
1:d
___
1:b
2:b
Albegraic Reasoning
Using a coordinate System
1: not multiple choice
__
1:c
2:a
___
1:a
2:c
3:d
4: not multiple choice
___
1:a
2:d
___
1:d
2:d
3:c
4:b
5:d
___
1:b
2:b
3:c
4:a
5:d
6:d
7:a
___
1:a
2:d
___
1: not multiple choice
___
1:d
2:a
Part 2: Calculator
Geometry Reasoning and Measurement
(Most of these you don't need to know how to do. Everything you don't need to worry about is marked with an asterisk. I included the answers just in case you were curious.)
*1:Not MC (multiple choice)
*2: a and c
___
*1:d
*2:a
*3:b
*4:a
*5:c
*6:Not MC
___
*1:a
*2:c
*3:Not MC
4:d
*5:c
*6:c
___
*1:a
*2:b
*3:Not MC
*4:Not MC
___
1:d
___
1: Not MC, but the answer is 4
2: Not MC, but the answer is 10
___
Data, Statistics, and Probability
(These ones you should use to study)
1:b
2:a
3:d
4:c
5:a
___
1:b
2:c
3:3
4:b
5:d
6:Not MC
___
1:c
2:b
3:d
4:b
5:b
6:b
___
Study Skills
1:d
2:a
3:d
4:b
Pink Packet Answers
Sample: C
1:D
2: H
3: D
4:H
5: D
6: F
7: D
8: J
9: A
10: J
11: B
12: G
13: D
14: F
15: A
16: G
17: D
18: J (You don't need to know how to do this one)
19: A
20: J
21: C
22: J
23: B
24: Y
25: A
26: F
27: B
28: J
29: C
30: J
31: B
32: G
33: D
34: H
35: (9, 41) (The answer is not listed as an option)
36: H
37: C
38: F
39: C
40: F
41: C (Don't need to know this one)
42: G (Again, you don't need to know this one)
43: A
45: A
46: G (Don't need to know this one)
47: B
Wednesday, May 11, 2011
Opposite Operations
Equality
Wednesday, March 30, 2011
EXPONENTS REVIEW
Exponents look like this:
23
The big number, 2, is called the base.
The little number, 3, is called the exponent.
The exponent tells us how many times we’re going to multiply the base by itself.
So 23 = 2*2*2
When we have exponents with variables, like this:
4x3
Coefficient: the number in front (4)
Variable/base: the part in the middle (x)
Exponent: little number in the corner (3)
If you have a term like 4x, with no exponent visible, the exponent is 1.
Like Terms must have the same variable with the same exponent.
EX: 3x3 , -2x3 and 5x3 are like terms because they have the same variable (x) and the same exponent (3).
EX: 3x2 3x and 3x3 are NOT like terms because they have different exponents.
ADDING AND SUBTRACTING
You can only add and subtract like terms. Otherwise, you’re adding apples and oranges.
When adding, we do not change the exponents.
Ex: Simplify
7x2 – 3x2
4x2
This is saying we have 7 x-squareds and we’re taking away 3 x-squareds, so we have 4 x-squareds left.
Ex: Simplify
4x3 + x2 – 5 + x3 – 2x2
We combine like terms:
4x3 + x3 = 5x3
x^2 + x^2 = 2x^2
5 has no like term, so we leave it alone.
So we get: 5x3 + 2x2 – 5
(Usually, we write polynomials so that the term with the biggest exponent comes first. Then the exponents get smaller and smaller as you go to the left.)
MULTIPLYING AND DIVIDING
You don’t need like terms to multiply or divide. Here, the exponents can change.
MULTIPLYING
To understand how to multiply with exponents, we have to remember what an exponent does.
Ex: Simplify
x2 * x3
Remember, x2 means x*x and x3 means x*x*x, so we can rewrite the problem as
x*x * x*x*x
Which we can write as x5
Notice, we are adding the exponents
Ex: Simplify
3x2y^3(4x5y^9)
First, multiply the constants: 3*4 = 12
Then we see how many x’s we are multiplying together. There are 2 in the first part and 5 in the second part, so altogether we are multiplying 7 x’s together, which is x7
There are 3 y’s in the first part and 9 y’s in the second part, so altogether, we have 12 y’s being multiplied, or y12
So our answer is: 12 x7y12
Ex: Simplify
6x3y4z(2x4yz2)
=12x^7y^5z^3
MULTIPLICATION RULE: Add the exponents of the same variable
DIVIDING
Dividing with exponents involves a lot of “canceling.” Again, we have to remember what the exponents mean.
EX: Simplify
y5
y3
This means
y*y*y*y*y
y*y*y
We can cancel three of the y’s in the top with the three y’s in the bottom, so we’re left with
y*y or y2
Notice, we take away the bottom exponent from the top exponent. This is subtracting.
DIVISION RULE: Subtract the bottom exponent from the top exponent of the same variable.
OTHER EXPONENTS
The division rule leads us to two important things in exponents.
First
x2
x2
There are two ways to think about this. One is to cancel x2 with x2 to get 1.
The other is to use the division rule of subtracting exponents to get x0.
Both answers are correct, so we see that
x0 = 1
Second
x2
x5
Again, there are two ways to look at this. If we use canceling, we get
1
x3
If we use the division rule, we get x-3
Again, both are valid representations of the original expression.
So we see that
1
x3 = x-3
This is true for any exponent.
In fact, a negative exponent will always change the position of the variable it affects.
EX: Simplify
4
x-6
The negative in the exponent moves the variable to the top of the fraction
4x6
POWER AND PARENTHESES
An exponent on the outside of parentheses is going to do something interesting.
EX: Simplify
(x5y2)3
OK. The exponent on the outside of the parentheses is telling us to multiply what’s inside the parentheses by itself three times, like this:
x5y2 * x5y2 * x5y2
Now, using our multiplication rule, we get x15y6
See how we got x5 three times and y2 three times? We are multiplying.
PARENTHESES RULE: An exponent outside the parentheses will multiply with the powers inside the parentheses.
Tuesday, March 15, 2011
SOLVING SYSTEMS OF INEQUALITIES
Graph all of the inequalities on the same set of axes.
Find the area where the solutions overlap.
EX:
y ≥ 3x – 1
x < 4
First, graph each inequality on the same set of axes:
Here’s y ≥ 3x -1 without shading
(Remember the line is solid because it’s greater than or equal to)
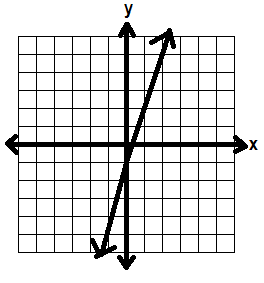
Then we’ll graph x < 4 on the same set of axes, again without shading.
(Remember this line is dotted because x is less than but not equal to 4)
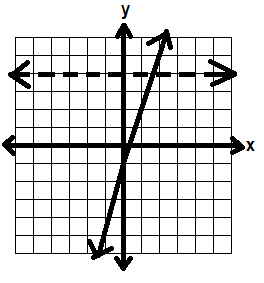
Now we need to look at the shading.
For y ≥ 3x – 1, let’s use test point (-1, 1)
Plug it into the inequality:
1≥ 3(-1) – 1
1≥ -3 – 1
1 ≥ -4
That’s true, so we shade on that side—the left side—of the line.
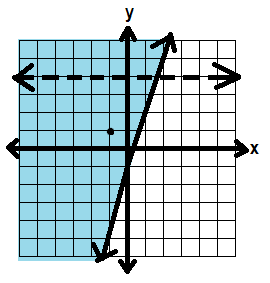
Let’s use that same test point for x < 4
-1 < 4
That’s also true, so we shade on the bottom side of that line.
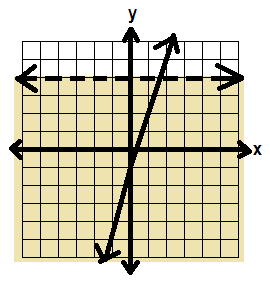
In this system, we want to look for the places that BOTH inequalities are true—where the shading overlaps.
That’s in the green area below:
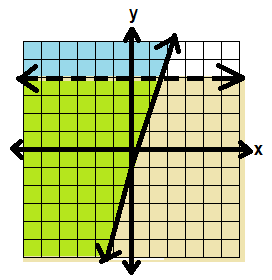
So our solution should look like this:
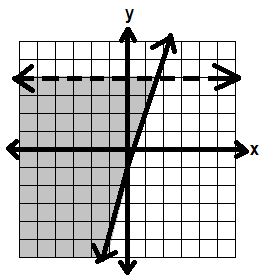
Note: You may have systems of inequalities with more than two inequalities. Then you want to find the area where all of them overlap.
Saturday, March 12, 2011
GRAPHING LINEAR INEQUALITIES
y = 2x -3
Here we have a slope of 2 and a y-intercept of -3. Let’s graph that line.

Now, let’s look at the inequality
y > 2x -3
Now y isn’t equal to 2x – 3, it’s greater than 2x – 3. To show that we don’t want to include the line y = 2x – 3, we turn our solid line into a dotted line.

Then, we shade in the part (on one side of the line) where y is greater than the line 2x – 3.
We can check if we should shade above or below by using test points. Pick a point on one side of the line, and a point on the other side.

Above, I picked (-1, 1) and (3, -1)
We test the points by plugging them into the inequality, y > 2x – 3.
(-1, 1): 1 > 2(-1) -3
1 > -2 -3
1 > -5 This is true, so we say that, yes,
at this point y is greater than 2x – 3.
(3, -1): -1 > 2(3) -3
-1 > 6 -3
-1 > 3 This is NOT true, so we say that,
no, at this point y is NOT greater than 2x -3.
So we shade in the side where (-1, 1) is:
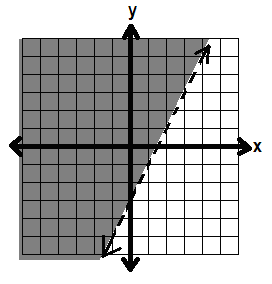
And the inequality is graphed.
STANDARD FORM
3x – 2y ≥ 6
First, we graph the line 3x – 2y = 6 by finding the x- and y-intercepts.
x-int: 2, y-int: -3

In this case, because we have greater than OR equal to, we include the line. So the line stays solid.
Now we need to know which side to shade. We pick a point on one side of the line.
Let’s pick (0, 0). Plug it into the inequality, 3x – 2y ≥ 6
3(0) – 2(0) ≥ 6
0 – 0 ≥ 6
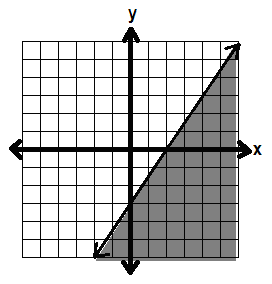
0 ≥ 6 This is false, so we don’t want to shade in
the side with (0, 0).
So we shade in the other side:
COMPOUND INEQUALITIES AND ABSOLUTE VALUES
EX: And
x > -3 and x < 5
And means that both have to be true. That is, x must be both bigger than -3 and smaller than 5.
So if we were to graph the above inequality, it would look like this:

Notice, it’s the space between -3 and 5—where x is both bigger than -3 and less than 5.
EX: Or
x ≥ 4 or x < 0
Or means that at least one has to be true. That is, x must be either greater than 4 or less than 0.
So is we were to graph the above compound inequality, it would look like this:

So the solutions are everything except 0 and the numbers between 0 and 4.
You may also have to solve compound inequalities, like this:
EX: Solving
3x – 1 > 5 and –x – 6 > 1
You can solve each separately.
3x – 1 > 5
+1 +1
3x > 6
3 3
x > 2
-x + 6 > 1
-6 -6
-x > -5
x < 5
So we have x > 2 and x < 5

Sometimes, the inequalities are joined like this:
-3 < x + 5 ≤ 8
In these cases, we assume that we are using and instead of or.
In these cases, you can separate the two inequalities and solve them individually:
-3 < x + 5 and x + 5 ≤ 8
Or you can solve the two simultaneously—solve for x in the middle.
-3 < x + 5 ≤ 8
-5 -5 -5
-8 < x ≤ 3
ABSOLUTE VALUES
An absolute value |x| gives the positive value of x. For example:
|3| = 3 because 3 is already positive
|-3| = 3 as well.
When we have absolute values in inequalities, we end up with compound inequalities.
EX: Absolute value
|x| ≤ 4
Let’s think about this inequality. The x clearly can’t be anything bigger than 4. But it also can’t be anything smaller than -4, because the absolute value of something like -5 would be 5.
So we can rewrite this inequality as
x ≤ 4 and x ≥ -4
or you can write it as -4 ≤ x ≤ 4
EX: Solving with an absolute value
5 < |x| - 2
+2 +2
7 < |x| Now we use that trick
-7 < x < 7
EX: Solving with an absolute value
4 < |x – 1| Here, we use the absolute value trick first, since the 1 is inside the absolute value
-4 < x – 1 < 4 Then solve.
Tuesday, March 1, 2011
Solving Systems by Graphing
| y | = | -2 x | - 4 |
|
|
| y | = | 1 x | + 5 |
|
|
|
|
| 4 |
|
|
|
Once you know how to graph, solving by graphing is easy.
1—Graph the two lines.
2—See where the two lines intersect.
Here, they intersect at (-4, 4)
That point is the SOLUTION.
3—Check your answer by plugging it in to the equations.
(You have to plug it into BOTH equations, since you are checking whether it is the solution to the SYSTEM, not to just one or the other of the equations.)
| 4 | = | -2 (-4) | - 4 |
|
|
| 4 | = | 8 | - 4 | That’s true, so (-4, 4) is a solution of the first equation |
|
|
|
|
|
|
|
|
| 4 | = | 1 (-4) | + 5 |
|
|
|
|
| 4 |
|
|
|
| 4 | = | -1 | +5 | That’s true, so (-4, 4) is a solution of the second equation. |
|
Since (-4, 4) is a solution to both equations, it is the SOLUTION of the SYSTEM.
And that is how you solve a system by graphing.
Wednesday, February 16, 2011
Solving Systems by Elimination
OK, OK. Now this is the third way we can solve systems of equations. It’s exciting!!!
Remember how you can do ANYTHING you want (except divide by 0) to one side of an equation, as long as you do the same thing to the other side of the equation?
Well, we can use this trick to add two equations together.
Take, for example, the following system of equations:
3x – 4y = -2
2x + 4y = -3
If we take 3x – 4y = -2, we can add 2x + 4y to one side of the equation, and 3 to the other side because 2x + 4y and 3 are equal. So we’re actually adding the same thing to both sides!
We add straight down, combining like terms.
| 3x | -4y | = | -2 |
|
| +2x | +4y |
| +(-3) |
|
| 5x | +0 | = | -5 |
|
| 5x |
| = | -5 | Woah, check it out! One of our variables is gone! Now we can solve for x! |
| x |
| = | -1 |
|
Cool. Now to find y, we just substititute -1 for x in one of the equations.
| 3(-1) | -4y | = | -2 | Simplify |
| -3 | -4y | = | -2 |
|
| +3 |
|
| +3 | Subtract 3 to get the y’s alone |
|
| -4y | = | 1 | And divide by -4 to get the y by itself |
|
| -4 |
| -4 |
|
|
| y | = | -1 4 | Hooray! We’re done! |
So our solution is (-1, -1/4)
We can either add or subtract our two equations, depending upon what will cancel out one of the variables.
MULTIPLYING TO ELIMINATE
Now, let’s look at an example where it’s a little bit harder to solve by elimination.
3x + 5y = 7
4x + 10y = 16
Oh great, there are no coefficients that are the same! How will we ever cancel things out!?!
Luckily, we can use that same super-useful math fact, that we can do whatever we want to an equation as long as we do it to both sides.
Watch what happens if we multiply the first equation by -2…
-2(3x + 5y) = -2(7)
-6x – 10y = -14
Now the coefficients of y will cancel! We replace the first equation with the multiplied by -2 equation we just made and solve by elimination!
| -6x | -10y | = | -14 | Add down |
| +4x | +10y | = | +16 | Combine like terms |
| -2x | +0 | = | 2 |
|
| -2x |
| = | 2 | Hooray! Only one variable! Let’s solve! |
| x |
| = | -1 |
|
Now we substitute that x = -1 back into one of our original equations, and we get:
| 3(-1) | + 5y | = | 7 | Simplify |
| -3 | + 5y | = | 7 |
|
| +3 |
|
| +3 | Solve for y by getting the y’s alone |
|
| 5y | = | 10 | Then dividing by 5 to get y by itself |
|
| 5 |
| 5 |
|
|
| y | = | 2 | Hooray! Now we know x and y! |
So our solution is (-1, 2)
Monday, February 14, 2011
Systems of Equations and Solutions
SYSTEM OF EQUATIONS
A “SYSTEM” is a set of equations with the same variables.
EX:
x - 3y = 12
2x + 4y = 4
We’re looking at systems of linear equations—equations of lines.
SOLUTIONS
The SOLUTION of a system of equations is made up of solutions that work for both equations.
EX: The solution to the equations above is x = 6, y = -2) because that point fits into both equations:
Plugging in 6 for x and -2 for y in the first equation, we get
6 – 3(-2) = 12
6 + 6 = 12
12 = 12
Plugging in 6 for x and -2 for y in the second equation, we get
2(6) + 4(-2) = 4
12 – 8 = 4
4 = 4
GRAPHING SYSTEMS
We can visualize systems by graphing the equations on the same set of axes. The solution is where the lines cross.
This is the graph of the example above. You can see the lines cross at (6, -2).
A system of equations may have ONE solution, MANY solutions, or NO SOLUTIONS.
If the lines cross ONCE, there is ONE specific solution.
If the lines are the SAME, they are crossing many, many times (at every single point on the line), so there are infinitely MANY SOLUTIONS.
If the lines are PARALLEL, there are NO SOLUTIONS, because the lines never cross.
(Note that these lines have the same slope but different intercepts.)
Wednesday, February 2, 2011
Graphing from Standard Form
Standard form of the equation of a line looks like this:
Ax + By = C
We want A, B, and C to be whole numbers, and we want A to be positive.
We can graph from standard form by using the x- and y-intercepts.
INTERCEPTS
The x-intercept is where the line crosses the x-axis.
The y-intercept is where the line crosses the y-axis.
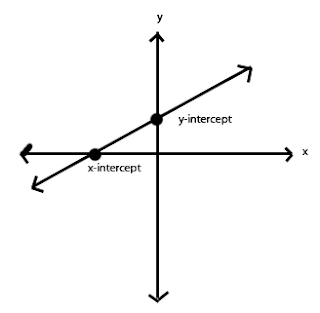
Note that at the x-intercept, y is zero. (We haven't moved up or down from the x-axis.)
At the y-intercept, x is zero. (We haven't moved right or left from the y-axis.)
GRAPHING FROM STANDARD FORM
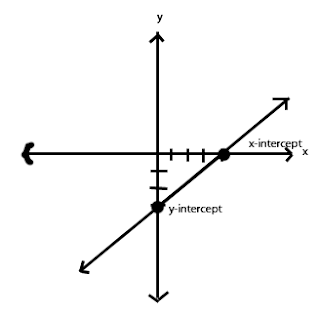
Ex: 3x-4y=12
To find the x-intercept, we plug in 0 for y.
3x-4(0)-12 ..........................4(0) becomes 0
3x=12 ................................ now divide both sides by 3
x=4
So 4 is the x-intercept.
To find the y-intercept, we plug in zero for x.
3(0)-4x-12 ..........................3(0) becomes 0
-4x=12 ................................now divide both sides by -4
x=-3
So -3 is the y-intercept.
Graph the two intercepts and draw a line through them.
Wednesday, January 26, 2011
Writing an Equation of a Line from a Graph
Equation
Remember the equation of a line is
y = mx + b
where m is slope (rise over run from one point to another)
and b is the y-intercept (where the line crosses the y-axis)
and x and y are variables
Graph
When we look at a graph, we can find the slope (m) and the y-intercept (b)
(We can also find lots and lots of x’s and y’s, but we’ll get to that later)

We find slope by looking at two points on the line. Here, we’re looking at (2, 1) and (4, 4).
We find the rise (how far it is from one y-value to the other—up and down) is 3—because we have to go up three to get from 1 to 4.
We find the run (how far it is from one x-value to the other—left and right) is 2—because we have to go to the right two to get from 2 to 4.
Then our slope is rise over run: 3/2.
We find the y-intercept by looking at where the line crosses the y-axis (the vertical line in the middle of the graph). Here, the line crosses the y-axis at -2. So the y-intercept is -2.
Write the Equation
Now we can write the equation with the information from the graph. We just plug in the slope for m, and the y-intercept for b in the slope-intercept equation y = mx + b.
y = (3/2)x - 2


